LogicMonitor Mobile Alerts
LogicMonitor
2.0 ★
store rating
Free
AppRecs review analysis
AppRecs rating 2.3. Trustworthiness 77 out of 100. Review manipulation risk 18 out of 100. Based on a review sample analyzed.
★★☆☆☆
2.3
AppRecs Rating
Ratings breakdown
5 star
10%
4 star
10%
3 star
7%
2 star
10%
1 star
62%
What to know
✓
Low review manipulation risk
18% review manipulation risk
✓
Credible reviews
77% trustworthiness score from analyzed reviews
⚠
Mixed user feedback
Average 2.0★ rating suggests room for improvement
About LogicMonitor Mobile Alerts
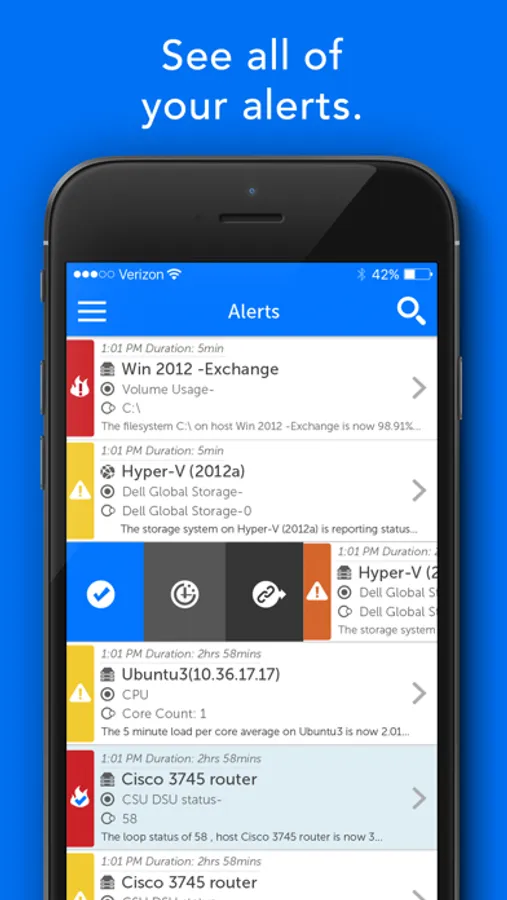
LogicMonitor mobile application is a triage tool, giving you the ability to easily view and interact with alerts and dashboards.
Have all your active alerts and associated graphs at your fingertips along with the ability to swipe to acknowledge and escalate alerts or schedule down time for a device.
LogicMonitor is a SaaS based performance monitoring platform. With LogicMonitor, you can instantly monitor the health and performance of your systems in one place at the same time. Embedded thresholds and operations best practices tell you everything about the health and performance of your systems, and proactively alert you to issues.
Current functionality:
• View Alerts & Dashboards
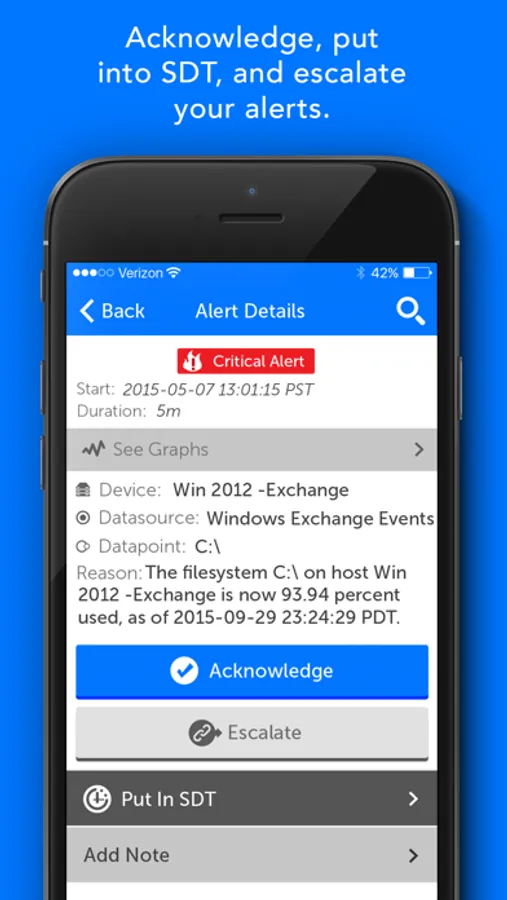
• Act on alerts → Acknowledge, Escalation, SDT and notes.
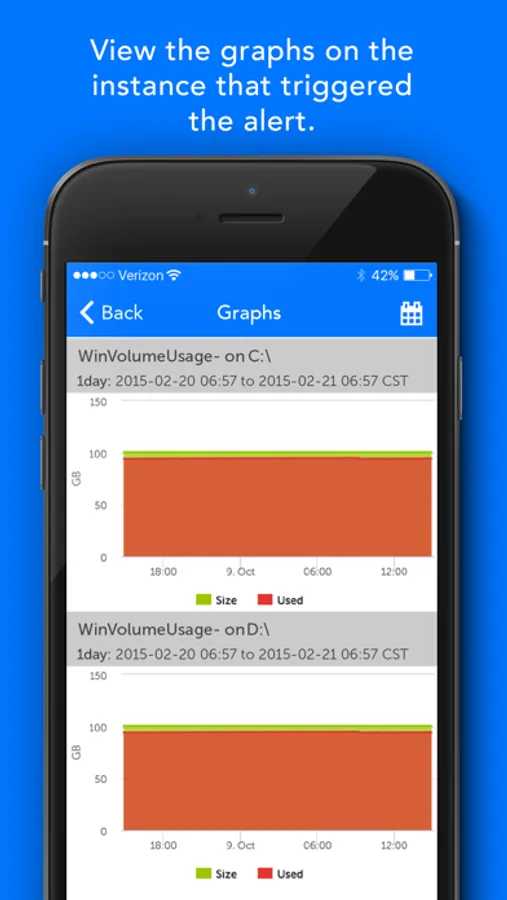
• Viewing of the device graphs of the instance that triggered the alert.
• Viewing of the rest of the device’s datasources/instance graphs.
• Viewing of dashboards.(Only viewing dashboards allowed by role of the user. Not creating them, only viewing dashboards created in main app.)
• Adjusting the time range on graphs and dashboards.
• Ability to search and sort alerts.
Have all your active alerts and associated graphs at your fingertips along with the ability to swipe to acknowledge and escalate alerts or schedule down time for a device.
LogicMonitor is a SaaS based performance monitoring platform. With LogicMonitor, you can instantly monitor the health and performance of your systems in one place at the same time. Embedded thresholds and operations best practices tell you everything about the health and performance of your systems, and proactively alert you to issues.
Current functionality:
• View Alerts & Dashboards
• Act on alerts → Acknowledge, Escalation, SDT and notes.
• Viewing of the device graphs of the instance that triggered the alert.
• Viewing of the rest of the device’s datasources/instance graphs.
• Viewing of dashboards.(Only viewing dashboards allowed by role of the user. Not creating them, only viewing dashboards created in main app.)
• Adjusting the time range on graphs and dashboards.
• Ability to search and sort alerts.