AppRecs review analysis
AppRecs rating 5.0. Trustworthiness 71 out of 100. Review manipulation risk 29 out of 100. Based on a review sample analyzed.
★★★★★
5.0
AppRecs Rating
Ratings breakdown
5 star
100%
4 star
0%
3 star
0%
2 star
0%
1 star
0%
What to know
✓
Low review manipulation risk
29% review manipulation risk
✓
Credible reviews
71% trustworthiness score from analyzed reviews
✓
High user satisfaction
100% of sampled ratings are 5 stars
About ImmGen
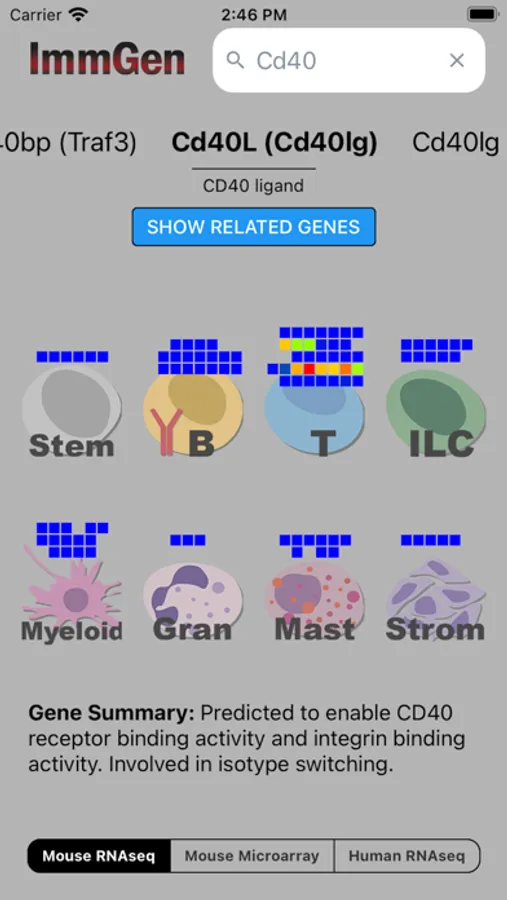
Explore gene expression levels in different mouse and human immune system cells. Start by entering a gene name (or alias) in the search bar to see a list of hits you can swipe through.
Searching will display a "heatmap barcode" that shows how hot or cold expression of that gene is across different immune system cell lineages (B cells, T cells, Myeloid cells, etc). Toggle between 3 different datasets: mouse RNA-seq, mouse microarray, and human RNA-seq.
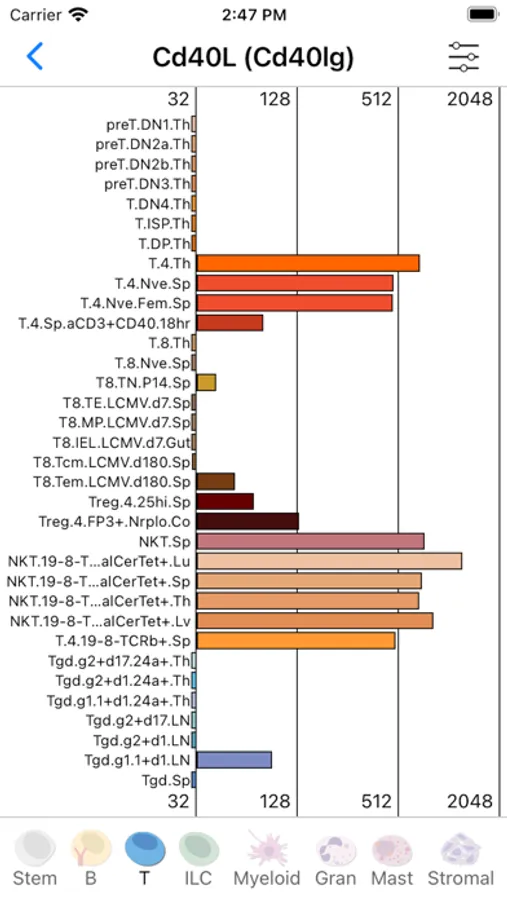
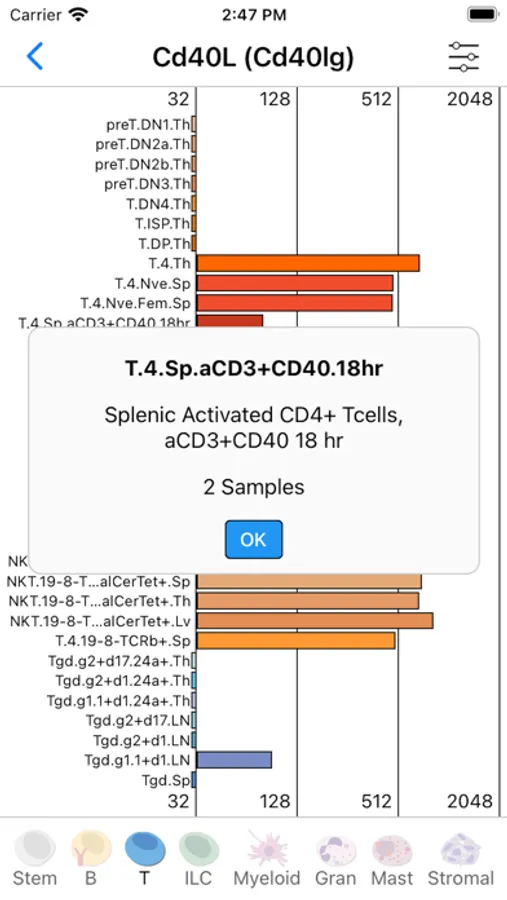
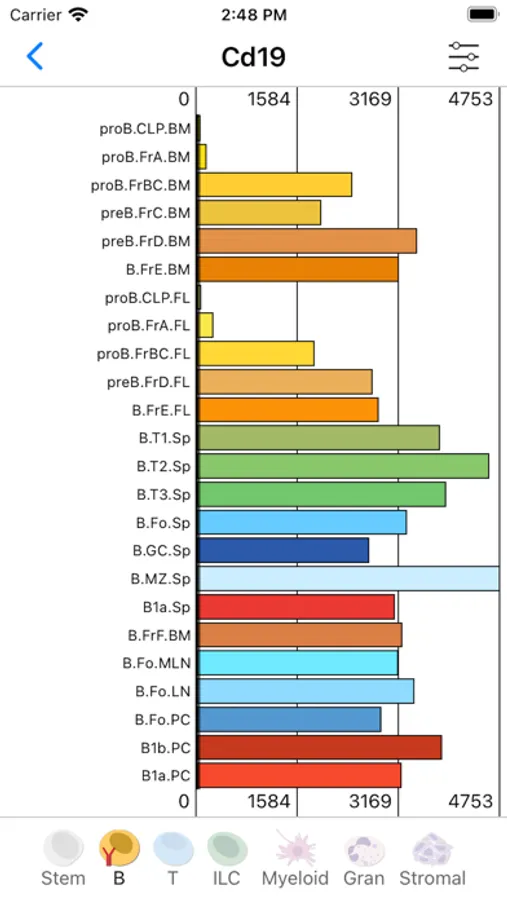
Press down on a cell lineage icon to see the same expression data visualized as a bar chart. Use the settings menu in the top right to toggle between a log and linear axis. In the microarray data, low expression values are partially occluded.
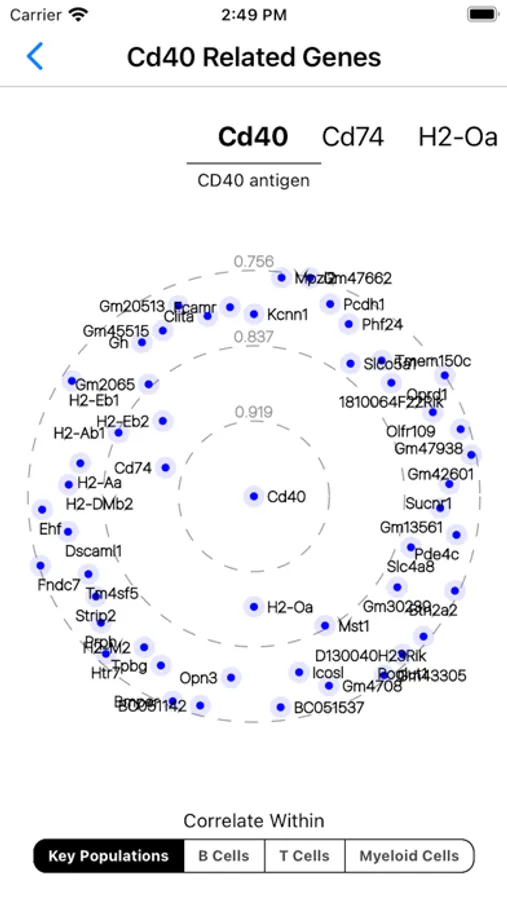
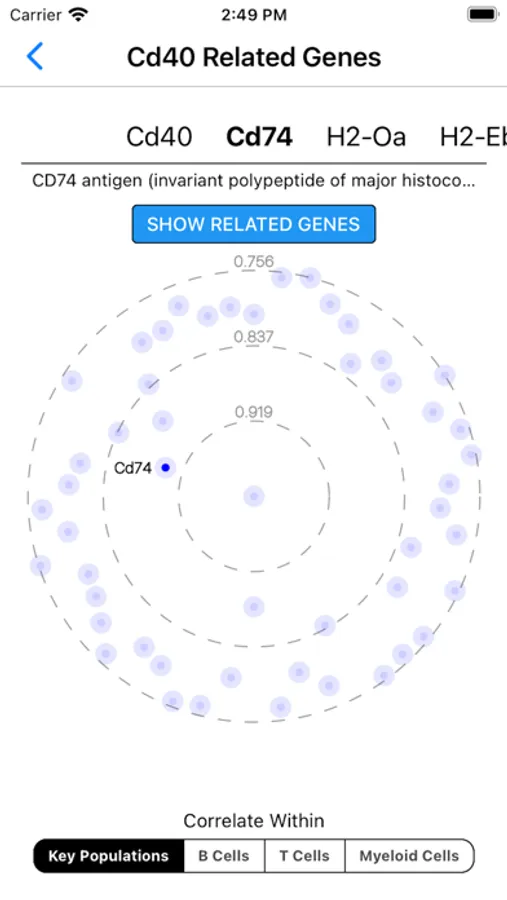
Back on the main "heatmap barcode" screen, if you instead press the "Show related genes" button, you'll see a "gene constellation" view. This shows its most correlated genes within certain population groups. By default, correlation is shown with respect to key populations — these are key populations across the entire immune system.
Please reach out to immgen@gmail.com for feedback or feature requests!
The data are generated by the Immunological Genome Project, an international consortium supported by the National Institutes of Health (NIAID).
Searching will display a "heatmap barcode" that shows how hot or cold expression of that gene is across different immune system cell lineages (B cells, T cells, Myeloid cells, etc). Toggle between 3 different datasets: mouse RNA-seq, mouse microarray, and human RNA-seq.
Press down on a cell lineage icon to see the same expression data visualized as a bar chart. Use the settings menu in the top right to toggle between a log and linear axis. In the microarray data, low expression values are partially occluded.
Back on the main "heatmap barcode" screen, if you instead press the "Show related genes" button, you'll see a "gene constellation" view. This shows its most correlated genes within certain population groups. By default, correlation is shown with respect to key populations — these are key populations across the entire immune system.
Please reach out to immgen@gmail.com for feedback or feature requests!
The data are generated by the Immunological Genome Project, an international consortium supported by the National Institutes of Health (NIAID).